E-ISSN:2349-3267
P-ISSN:2349-5499

Research Article

Assessment

Pediatric Review - International Journal of Pediatric Research

2020 Volume 7 Number 6 July-August
Publisherwww.medresearch.in

Assessment of prevalence of risk factors for non-communicable diseases in early adolescent age group using Global School Health Survey in Ujjain, Madhya Pradesh, India

Sharma P.1, Chandra Mandliya J.2*, Dhaneria M.3, Diwan V.4
DOI: https://doi.org/10.17511/ijpr.2020.i06.02

1 Priyanka Sharma, Resident, Department of Pediatrics, R.D Gardi Medical College, Ujjain, Madhya Pradesh, India.

2* Jagdish Chandra Mandliya, Professor, Department of Pediatrics, R.D Gardi Medical College, Ujjain, Madhya Pradesh, India.

3 Mamta Dhaneria, Professor and Head, Department of Pediatrics, R.D Gardi Medical College, Ujjain, Madhya Pradesh, India.

4 Vishal Diwan, Scientist E, National Institute for Research in Environmental Health, Bhopal, Madhya Pradesh, India.

Introduction: There has been a global rise in non-communicable diseases and a shift in trends from infectious to chronic lifestyle-related diseases, roots of which are behaviourally acquired and begin during adolescence. Adolescence constitutes a natural partner for their prevention. Objective: To determine the prevalence of risk factors for non-communicable diseases in the early adolescent age group using a global school-based health survey among students of Ujjain. Method: Cross-sectional study was done for 24 months from August 2017 to August 2019 in schools of Ujjain, Madhya Pradesh. Sampling was done using a cluster sampling technique. Students who participated were administered a questionnaire based on the GLOBAL SCHOOL HEALTH SURVEY. Appropriate statistical methods were used to find the odds ratio for the prevalence of the risk factors and differences among sex, residence (urban or rural), and type of school (government or private). Result: This study documents that among 400 students lack exercise, consumption of junk food =44.5%, high alcohol consumption 16.8 %, smoking cigarettes was found to be prevalent risk factors of NCDs. There was a statistically significant difference noted among types of school, residence, and sex. Conclusion: This is the first study done in this region and emphasizes individual health interventions along with the implementation of national health policies targeting the adolescent age group to lower the financial and health care burden of the region.

Keywords: Non-communicable Diseases (NCD), WHO, Age

Corresponding Author How to Cite this Article To Browse
Jagdish Chandra Mandliya, Professor, Department of Pediatrics, R.D Gardi Medical College, Ujjain, Madhya Pradesh, India.
Email:
Sharma P, Mandliya JC, Dhaneria M, Diwan V. Assessment of prevalence of risk factors for non-communicable diseases in early adolescent age group using Global School Health Survey in Ujjain, Madhya Pradesh, India. Pediatric Rev Int J Pediatr Res. 2020;7(6):228-236.
Available From
https://pediatrics.medresearch.in/index.php/ijpr/article/view/609

Manuscript Received Review Round 1 Review Round 2 Review Round 3 Accepted
2020-07-18 2020-07-30 2020-08-07 2020-08-25
Conflict of Interest Funding Ethical Approval Plagiarism X-checker Note
No Nil yes 9%

© 2020 by Priyanka Sharma, Jagdish Chandra Mandliya, Mamta Dhaneria, Vishal Diwan and Published by Siddharth Health Research and Social Welfare Society. This is an Open Access article licensed under a Creative Commons Attribution 4.0 International License https://creativecommons.org/licenses/by/4.0/ unported [CC BY 4.0].

Introduction

As per the World Health Organization, in 2015 out of the 56.1 million global deaths, seventy percent were due to non-communicable diseases (NCD) [1]. In the last few years, there has been a changing pattern of disease profile from acute infectious communicable disease to chronic NCD [2]. The recent changes in lifestyle and economy have put young and adolescents at risk of various behavioral factors predisposing to the development of NCDs and adolescents have been identified as a major at-risk population for NCDs by the WHO[3].

It has been estimated that the burden of NCDs can be reduced to half or lesser by prioritizing interventions like health education, health promotion, and disease prevention which can be achieved by focusing on modifiable risk factors the roots of which begin as early as in childhood [2]. Appropriate counseling and positive reinforcement during any age including adolescence make a significant difference in morbidity and mortality [4].

Preventive strategy to be formulated before the execution of any intervention in terms of screening and risk factor reduction, require the actual situation in the community has to be estimated [5]. The present study has been carried out to determine the prevalence of these risk factors and the proportion of modifiable risk factors to assess the co-existence of these among school-going adolescents in Ujjain.

Material and Methods

A cross-sectional study was undertaken in schools in the district of Ujjain from August 2017 to August 2019. The study was done following the international Global School Health Survey protocol (GSHS), developed by the Global School Health Survey international network of researchers. The Global School Health Survey is a cross-sectional survey, it measures among adolescents the leading cause of morbidity and mortality through the behavior and risk factors for non-communicable diseases [6].

The study was conducted in the Ujjain district situated in Madhya Pradesh. As per provisional reports of Census India, the population of Ujjain in 2011 was 1,986,864. The study was conducted among students in the adolescent age (12-14 years) group in urban and rural schools of Ujjain, which included both government and private schools.

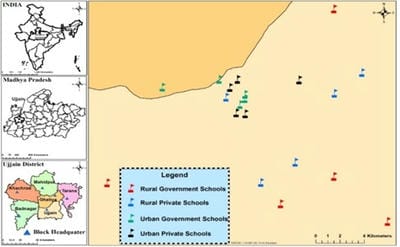
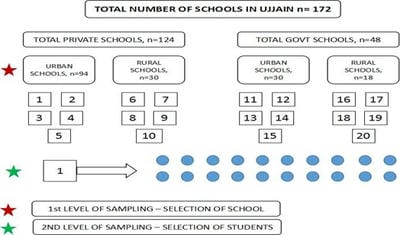
The Global School Health Survey was done amongst students enrolled in grades eight and nine. A complete list of the schools was obtained from the district education department. A two-stage cluster sampling technique to obtain samples of students to be included in the study was used, each sampling frame of the identified class and age group of the school in a geographically defined area are selected. The first level of sample selection is schools i.e. STRATUM. The probability of schools selected is proportional to the number of students enrolled in a specific grade using a random start, twenty schools were sampled which included schools from the urban and rural areas of Ujjain which was further divided into private and government schools. Following the selected schools were approached one day before the study with the data regarding the study and its details. In case a school refused to participate in the study the next schools were selected based on simple random sampling. At the second stage, systematic equal probability sampling with a random start was used to select students from each of the sampled schools.

pedia_609_01.png

Fig-1: Describes the schools participating in the survey.

pedia_609_02.jpg

Fig-2: Describes the sample selection

Ethical Clearance: The study was approved by the Institutional Ethics Committee Ref no. 78/2017, R.D. Gardi Medical College, Ujjain, Madhya Pradesh,


India.

Ethical Consideration: A prior written informed consent for the study was taken from school administration and from the parents. At the time of initiating the study each participant was informed about the study protocol and voluntary participation

in the study, the anonymity of the students was also informed to them. After the completion of the questionnaire, a brief session for students was taken with regard to health education, hand washing, hygiene, diet, substance abuse, physical activity. The study was done following the international Global School Health Survey protocol (GSHS), developed by the Global School Health Survey international network of researchers. The Global School Health Survey is a cross-sectional survey, it measures among adolescents the leading cause of morbidity and mortality through the behavior and risk factors for non-communicable diseases.

Data Collection: The questionnaire was pilot studied and pretested amongst 20 school going children selected randomly among students different from the samples of the main study to have an overview of the study settings and requirements. Prior written consent for the study was taken from school administration one day before the study. In case a school refused to participate the next school was selected based on random sampling. Two schools refused to participate in the study. In the selected schools all the students in the selected classes were ready to participate.

At the time of initiating the study, each participant was informed about the study protocol and written consent was obtained. The students were also explained about the purpose and methodology of the study. The name of the schools and students were kept confidential. Participation was voluntary and anonymity was assured.

Data was collected using the self-administered questionnaire which was developed based on the WHO Global School Health Survey questionnaire. Since some of the schools were Hindi medium schools, the students were given a questionnaire that was translated to Hindi by a translator well versed with the language and rechecked by an expert of the same. The questionnaire was then explained in detail to every student to avoid misinterpretations or uncertainty of the questions. It took 60 minutes to complete the questionnaire after which the questionnaires were collected. Care was

taken to prevent discussion among the participants to avoid bias or peer influence in the answering of questions. Information regarding the lifestyle and potential risk factors for the non-communicable diseases of the students were collected. The questionnaire focuses on the intake of fruits and vegetables, exercise alcohol, smoking, and physical activity, details of which have been provided in the Annexure.

Questionnaire: Details of the demographic variables and behavioral risk factors such as alcohol use, smoking, drug use, physical activity level, nutritional dietary level was obtained using the GSHS format of the WHO, which was translated into a vernacular language and administered. For the purpose of analysis, all the entries were entered in excel and rechecked for errors, following this data was reclassified and using SSPS results were tabulated and details of which have been provided in the results section.

Data Analysis: Data were entered and analyzed through SPSS version 3.0. Descriptive statistics and analysis were conducted to understand the difference between the genders, residence based on urban or rural and type of school private or government, this was expressed in the form of p-value and chi-square test.

Results

We approached 400 participants of which, 261 (66%) were males and 139 (34%) were females in the age group of 12 to 14 years. 198 (49%) were from urban schools and 202 (51%)from rural schools, with 198 (49%) from Govt. schools and 202 (51%) from private schools .6 domains have been selected in the study and results have been presented under each domain Alcohol abuse, Dietary behavior, Drug use, Physical activity, Tobacco use, Violence, and unintentional injury.

Among the total number of children who participated in the study, 16.8 % consumed alcohol. It was noted that 19.8 % of males and 10.8 % of females have reported consuming alcohol. 18.3% of children residing in rural areas and 15.3 % in an urban area, with 24.9 % studying in Govt. schools and 8.9 % studying in private schools. There was a statistically significant difference noted among Students.

In the present study among the students who participated 85.8% never went hungry in the past


30 days, 10.5% and 15% rarely and sometimes went hungry. In the government schools, it was noted 17.4% rarely went hungry and 7.5% sometimes went hungry. There was a significant association noted between government and private schools. 35% did not consume fruits in the past 30 days with 56.5% less than or 1 time a day and 8.5% more than 1 time a day. 58.3% reported consuming vegetables less than 2 times a day and 41.8% more than 2 times a day. 96% reported consumption of carbonated drinks less than or equal to 1 time a week and 16 % more than 1 time a week. Fast food consumption of more than 1 time a week was noted in 44.5%

As per the study, 73.6% of children reported being physically active for at least 60 minutes a day, only 28% of males and 31.7% of females responded that they perform for more than 3 days for more than 60 minutes per day. Nearly 58.6 % of males and 59% of females mentioned they used to cycle or walked to reach school for more than 2 days a week. only 3% of government school children went to a physical education class more than 2 days a week as compared to that of 6.5% in private schools.

24.1% of children from private schools spent time sitting and watching television as compared to that of 7.1% of children studying in government schools.

As per the present study, 32% of children have reported smoking cigarettes, 18% females, and 41% males. 5% of children reported using tobacco in other forms other than smoking, smokeless tobacco. 30% of students have reported being exposed to second-hand smoke. 14% of students reported a parent using tobacco with a statistically significant difference noted.

Table-1: Demographic profile.

Variables Count N %
Sex Male 261 65.3
Female 139 34.8
Residence Rural 202 50.5
Urban 198 49.5
Age 13 years 240 60.0
14 years 160 40.0
Class 8 140 35.0
9 136 34.0
10 124 31.0

Table-2: Prevalence of risk factors in the study.

  Count N %
Drink No 330 82.5
Yes 70 17.5
How old were you when you first tried a cigarette? No 269 67.3
<= 11 years 67 16.8
> 11 years 64 16.0
During the past 30 days, on how many days did you use any tobacco products other than cigarettes, 0 days 380 95.0
1 or 2 days 20 5.0
During the past 30 days, how many times per day did you usually eat fruit? I did not eat fruit during the past 30 days 140 35.0
Less than one time per day 139 34.8
1 time per day 87 21.8
2 times per day 34 8.6
During the past 30 days, how many times per day did you usually eat vegetables? <= 2 times 233 58.3
> 2 times 167 41.8
During the past 30 days, how many times per day did you usually drink carbonated soft drinks? <= 1 times 384 96.0
> 1 time 16 4.0
During the past 7 days, on how many days did you eat food from a fast-food restaurant? < = 1 days 178 44.5
> 1 days 222 55.5
During the past 7 days, on how many days were you physically active for a total of at least 60 minutes per ay? No 66 16.5
<= 2 days 217 54.3
> 2 days 117 29.3
During the past 7 days, on how many days did you walk or ride a bicycle to or from school? No 65 16.3
< = 2 days 100 25.0
> 2 days 235 58.8

Table-3: Prevalence of risk factors among male and female.

  Sex Chi-square test p-value
Male Female
Count (N%) Count (N%)
Drink No 209 (80.1) 121 (87.1) 3.6060.165
Yes 52 (19.9) 18 (12.9)  
How old were you when you first tried a cigarette? No 155 (59.4) 114 (82.0) 30.174<0.005
<= 11 years 46 (17.6) 21 (15.1)  
> 11 years 60 (23.0) 4 (2.9)  
During the past 30 days, on how many days did you use any tobacco products other than cigarettes, 0 days 245 (93.9) 135 (97.1) 2.020.155
1 or 2 days 16 (6.1) 4 (2.9)  
During the past 30 days, how many times per day did you usually eat fruit? I did not eat fruit during the past 30 days 84 (32.2) 56 (40.3) 17.98<0.005
Less than one time per day 116 (44.4) 23 (16.5)  
1 time per day 48 (18.4) 39 (28.1)  
2 times per day 13 (5.0) 21 (14.1)  
During the past 30 days, how many times per day did you usually eat vegetables? <= 2 times 151 (57.9) 82 (59.0) 0.0480.826
> 2 times 110 (42.1) 57 (41.0)  
During the past 30 days, how many times per day did you usually drink carbonated soft drinks? <= 1 times 253 (96.9) 131 (94.2) 1.7090.191
> 1 times 8 (3.1) 8 (5.8)  
During the past 7 days, on how many days did you eat food from a fast-food restaurant? < = 1 days 103 (39.5) 75 (54.0) 7.7140.005
> 1 days 158 (60.5) 64 (46.0)  
During the past 7 days, on how many days were you physically active for a total of at least 60 minutes per day? No 30 (11.5) 36 (25.9) 17.299<0.005
<= 2 days 158 (60.5) 59 (42.4)  
> 2 days 73 (28.0) 44 (31.7)  
During the past 7 days, on how many days did you walk or ride a bicycle to or from school? No 33 (12.6) 32 (23.0) 10.2060.006
< = 2 days 75 (28.7) 25 (18.0)  
> 2 days 153 (58.6) 82 (59.0)  

Table-4: Prevalence of risk factors among the type of school.

  Type of School Chi-square test p-value
Government Private
Count N % Count N %
Drink No 149 (74.1) 181 (91.0) 20.10<0.005
Yes 52 (25.9) 18 (9.0)  
How old were you when you first tried a cigarette? No 134 (66.7) 135 (67.8) 23.10<0.005
<= 11 years 48 (23.9) 19 (9.5)  
> 11 years 19 (9.5) 45 (22.6)  
During the past 30 days, on how many days did you use any tobacco productsother than cigarettes? 0 days 193 (96.0) 187 (94.0) 0.8850.307
1 or 2 days 8 (4.0) 12 (6.0)  
During the past 30 days, how many times per day did you usually eat fruit? I did not eat fruit during the past 30 days 116 (57.7) 24 (12.1) 92.209<0.005
Less than one time per day 30 (14.9) 109 (54.8)  
1 time per day 46 (22.9) 41 (20.6)  
2 times per day 9 (4.5) 25 (12.6)  
During the past 30 days, how many times per day did you usually eat vegetables? <= 2 times 107 (53.2) 126 (63.3) 4.180.041
> 2 times 94 (46.8) 73 (36.7)  
During the past 30 days, how many times per day did you usually drink carbonated soft drinks? <= 1 times 198 (98.5) 186 (93.5) 6.6150.010
> 1 times 3 (1.5) 13 (6.5)  

During the past 7 days, on how many days did you eat food from a fast-food restaurant? < = 1 days 140 (69.7) 38 (19.1) 103.48<0.005
> 1 days 61 (30.3) 161 (80.9)  
During the past 7 days, on how many days were you physically active for a total of at least 60 minutes per day? No 41 (20.4) 25 (12.6) 13.4150.001
<= 2 days 117 (58.2) 100 (50.3)  
> 2 days 43 (21.4) 74 (37.2)  
During the past 7 days, on how many days did you walk or ride a bicycle to or from school? No 45 (22.4) 20 (10.1) 96.002<0.005
< = 2 days 8 (4.0) 92 (46.2)  
> 2 days 148 (73.6) 87 (43.7)  

Discussion

As the country is undergoing rapid economic development, changing lifestyles and habits have resulted in a transition in the health profile of the population [7]. Among all backgrounds, schools form an ideal setting to assess the prevalence among adolescent’s children for risk factors of NCDs, as it covers a vast population and it provides opportunities for the appropriate level of intervention at all stages and helps in formulating region-specific guidelines for the same [8].

Alcohol Use: Jaisoorya et al reported a prevalence of 9.9% among 12-13 years’ age group [9]. With similar results noted by Mohanan et al Udupi with a prevalence of 5.7% [10] Mahmood et al with results on prevalence in Bareilly, Uttar Pradesh with 3.2% children admitted to having consumed alcohol in the past 30 days and 5.2% having consumed alcohol in the past [11]. Jain et al reported a prevalence of 4.6%, of which 57.9% were males and 42.1% were females [12].

Mangalore Bukelo et al reported in their study with a similar setting that only one boy admitted to having consumed alcohol [13].

GSHS survey 2006 India did not study alcohol consumption among the risk factors for NCDs. On comparison there is a higher percentage of alcohol consumption noted in this study, a statistical significance noted in males and females could be males have easy accessibility to money for buying alcohol, peer pressure and male parent or guardian consuming alcohol

  1. Dietary Behaviour: A study done in CBSE school in Delhi in 2006 using the same GSHS survey reported 3.5+-0.7 % of children went hungry due to inadequate food in 30 days [14]. Bukelo et al reported in a similar study that 21.5% of adolescents consumed fruits and vegetables more than 2 days a week. 80.1% had inadequate dietary consumption [13].

Mahmood SE et al reported in an imitation study that 70.8% consumed fast food daily. 64% consumed fruits 3 days per week and 75.6% of vegetables 3 days per week [13]. There is a higher percentage of children going hungry in the present study could be due to a small sample size of the study. Operational definitions with regard to the adequacy of fruit and vegetable intake were not provided in the study to make a definitive comparison. There was a lower percentage of consumption of carbonated drinks as compared to a similar study this could be explained on the basis of health education being routinely provided in schools and in the community.


  1. Drug Use: Tsering et al reported in their study 12.5% of adolescent children abused drugs, with 15.1% urban children and 10% rural [15]. A study done in a similar setting by Katoki et al stated that 21.7% of children report drug abuse in the family [16]. As per a study done by project Udaya in Bihar and UP reported use of brown sugar (a heroin product) cocaine, ganja ( cannabis ), charas (cannabis) 0.1% in the young adolescent. As per the international narcotics control report, the total addicts in the country (44%) 4.54 percent belong to 12 -17 years. A similar study conducted in India among CBSE school children using GSHS 2006 did not report on drug abuse, so no data available for comparison in similar study methods [14]. The studies available for drug abuse have varied reporting which is due to the socio-economic and demographic differences in the population studied, behavioral and psychological factors such as family income and mental health have not been studied in the present study which has an influence on the substance abuse. A lower percentage of children using drugs could be due to a limited sample of children and no easy availability.

  1. Physical Activity: Study by Jain et al in Mangalore a similar setting noted that adequate vigorous activity was done only by 25.6% students and adequate moderate activity was done by 66.3% students [12]. Ade et al reported similar results in Karnataka with 22.1% of students doing physical activity daily [13]. GSHS has done in Delhi in 2007 reported with similar settings that 23.2% of children spent more than 3 hours a day watching television or playing video games [6]. Ismail et al reported a lack of physical activity in 44.6 % [17]. .The present study participants, the majority fail to meet the WHO recommendation on physical activity, 60 minutes of moderate to vigorous-intensity physical activity daily. The above study cannot be adequately compared to that of other studies due to a lack of operational definitions for adequate moderate or vigorous physical activity.
  2. Tobacco Use: Global youth tobacco survey reported that one in 10 students (10%) had used tobacco in any form. Kumar et al in Chennai estimated the prevalence of tobacco use to be 41.1% [11]. Mohammad et al reported a past smoking rate of 5.2%, currently smoking adolescents were 4.8%, 4.8% were also noted to be using smokeless tobacco, 2.4% used smokeless tobacco in the past(11). Puwar et al in Surat reported no adolescent smoking in their study [3]. Jain et al reported 1.2% of students all males to have smoked tobacco, and only 4 students to have smoked about 5 cigarettes three times a week in the past 30 days [12]. The GSHS Delhi in 2006, reported 1.2% of students who smoked cigarettes with 3.7% who have used tobacco in any form other than smoking and 37.1% exposed to second-hand smoking. The present study denotes an increase in smoking, tobacco use of which increase in prevalence was noted to be more in private school’s possible reason could be due to peer pressure

Violence and unintentional injury: Gururaj as per a study reported that in 2009, among children <14 y, major causes of fatal injuries were RTIs (31%) [18]. Report from 68 LMICs using GSHS survey, the overall prevalence of physical attack, physical fighting, and serious injuries during the past 12 months were 35·6%, 36·4%, and 42·9% respectively. Prevalence varied by WHO region [1]. The overall prevalence of bullying at least once in the past 30 days was 34·4%, irrespective of age,

and sex. A similar study conducted by WHO did not report on violence and unintentional injuries. No data is available with a similar setting for comparison among adolescents.

Conclusion

Non-communicable diseases are among the major health problems in India and globally. Many of the unhealthy and poor lifestyle practices that contribute to risk factors for NCDs in later adulthood start during adolescence. This is due to the transformation in the lifestyles of young adolescents from being physically active and consuming more of home-cooked food to being physically inactive and eating fast food.

From the present study, it is concluded that there are major risk factors documented among the high school students of Ujjain that are, a higher percentage of alcohol consumption in adolescents with a statistically significant difference among males and females, not having adequate vegetables and fruits in the diet and not doing the recommended physical activity daily among school-going adolescents. The study notes a lower percentage of tobacco and drug abuse. Violence and unintentional injuries are also reported on the lower percentage.

What does the study add to the existing knowledge?

This study recommends health promotion practices for prevention of risk factors among school-going adolescents, lifestyle modifications such as restriction of tobacco and alcohol use, high intake of fruits and vegetables and increased physically activity are required to be implemented for a better future of the health care system

There is a need for improving the knowledge and awareness regarding NCDs and its related risks along with which we require actions that will help to bridge the knowledge-practice gap for eating and exercise habits. Apart from which early diagnosis with proper treatment facilities must be provided to the already existing population having NCDs. Community participation is essential for the prevention of risk factors. Parents should be educated about the importance of playing games and a balanced diet.


Author’s contribution

Dr. Priyanka Sharma: Study design, concept

Dr. Jagdish Chandra Mandliya: Manuscript preparation

Dr. Mamta Dhaneria: Data analysis

Dr. Vishal Diwan: Manuscript preparation

Reference

  1. World Health Organization. Global status report on noncommunicable diseases 2014. World Health Organization. 2014.
  2. Shayo FK. Co-occurrence of risk factors for non-communicable diseases among in-school adolescents in Tanzania- An example of a low-income setting of sub-Saharan Africa for adolescence health policy actions. BMC Public Health. 2019;19(1)1–8.
  3. Puwar T, Saxena D, Yasobant S, Savaliya S. Noncommunicable Diseases among School ‑ going Adolescents- A Case Study on Prevalence of Risk Factors from Sabarkantha District of Gujarat , India. Indian J Comm Med. 2018;43(1)S33.
  4. Pengpid S, Peltzer K. Prevalence and correlates of behavioral non-communicable diseases risk factors among adolescents in the seychelles- Results of a national school survey in 2015. Int J Environ Res Public Health. 2019;16(15)2651.
  5. Ene-Obong H, Ibeanu V, Onuoha N, Ejekwu A. Prevalence of overweight, obesity, and thinness among urban school-aged children and adolescents in southern Nigeria. Food Nutr Bull. 2012;33(4)242-250.
  6. Maimela E, Alberts M, Modjadji SEP, Choma SSR, Dikotope SA, Ntuli TS, et al. The prevalence and determinants of chronic non-communicable disease risk factors amongst adults in the Dikgale Health Demographic and Surveillance System (HDSS) site, limpopo province of South Africa. PLoS One. 2016;11(2)1-18.
  1. Al-Sagarat AY, Al Kalaldeh MT. Prevalence of health-risk behaviours among government schools’ students in Jordan. Iran J Public Health. 2017;46(12)1669-1678.
  2. Gujjarlapudi C, B K V, Professor A. Risk factors for Non Communicable Diseases (NCD) among High School Students in an Urban Setting. Int J Recent Trends Sci Technol. 2013;7(2)82-85.
  3. Jaisoorya TS, Beena K V, Beena M, Ellangovan K, Jose DC, Thennarasu K, et al. Prevalence and correlates of alcohol use among adolescents attending school in Kerala, India. Drug Alcohol Rev. 2016;35(5)523-529.
  4. Parsekar SS, Ashok L, Monteiro AD, Singh MM, V BT. Modifiable life style associated risk factors for non communicable diseases among students of pre - ­university college of Udupi taluk. Glob J Med Public Health. 2015;4(2)2277-9604.
  5. Mahmood SE, Bilal Khan KM, Agrawal AK. Study of lifestyle disease risk factors among school going adolescents of urban Bareilly, Uttar Pradesh, India. Int J Community Med Public Heal. 2017;4(2)516.
  6. Dhanawat J, Kotian Ms, Angeline R, Jain A. Assessment of risk factors of non-communicable diseases among high school students in Mangalore, India. Int J Heal Allied Sci. 2012;1(4)249.
  7. Bukelo MF, Kiran D, Ramakrishna GB, Bukelo MJ, Kiran PR, Kulkarni V, et al. Risk factors for Non-Communicable diseases among rural adolescents- A school-based cross-sectional study. Asian J Pharm Clin Res. 2015;8(2)284-287.
  8. World Health Organization. Global School-based Student Health Survey (GSHS)- 2006 India. Central Board of Secondary Education (CBSE) GSHS questionnaire. 2006.
  9. Jiloha RC. Prevention, early intervention and harm reduction of substance use in adolescents. Indian J Psychiatry. 2017;59(1)111-118.

  1. Katoki K, Bhagabaty SM, Kalita M. Silhouette of substance abuse amongst an adolescent sample group from urban slums of Guwahati metro, North East India. Int J Med Res Heal Sci. 2016;5(3)1-8.
  2. Ismail IM, Venugopalan PP, Sarada AK, Binub K. Prevalence of non-communicable diseases risk factors among college students of Anjarakandy Integrated Campus, Kannur, Kerala, India. JMS - J Med Soc. 2016;30(2)106-110.
  3. Gururaj G. Symposium on chronic noncommunicable diseases and children Injury Prevention and Care - An Important Public Health Agenda for Health, Survival and Safety of Children. Indian J Pediatr. 2012.